Opioid Crisis in NY
Motivation
“Opioids kill more people each year than traffic accidents, than guns. Increasingly, they’re killing children. New synthetic drugs are emerging – cocktails so potent even touching them can lead to injury or death…”
The United States is experiencing a drug overdose epidemic fueled by prescription painkillers and an increase in the use of street drugs such as heroin and fentanyl. This crisis affects not only adolescents, but increasingly harms newborn babies and the elderly. According to the White House, “The number of babies born drug-dependent increased by 500 percent between 2000 and 2014. Almost a third of all children placed in foster care are from families with parental drug abuse”.
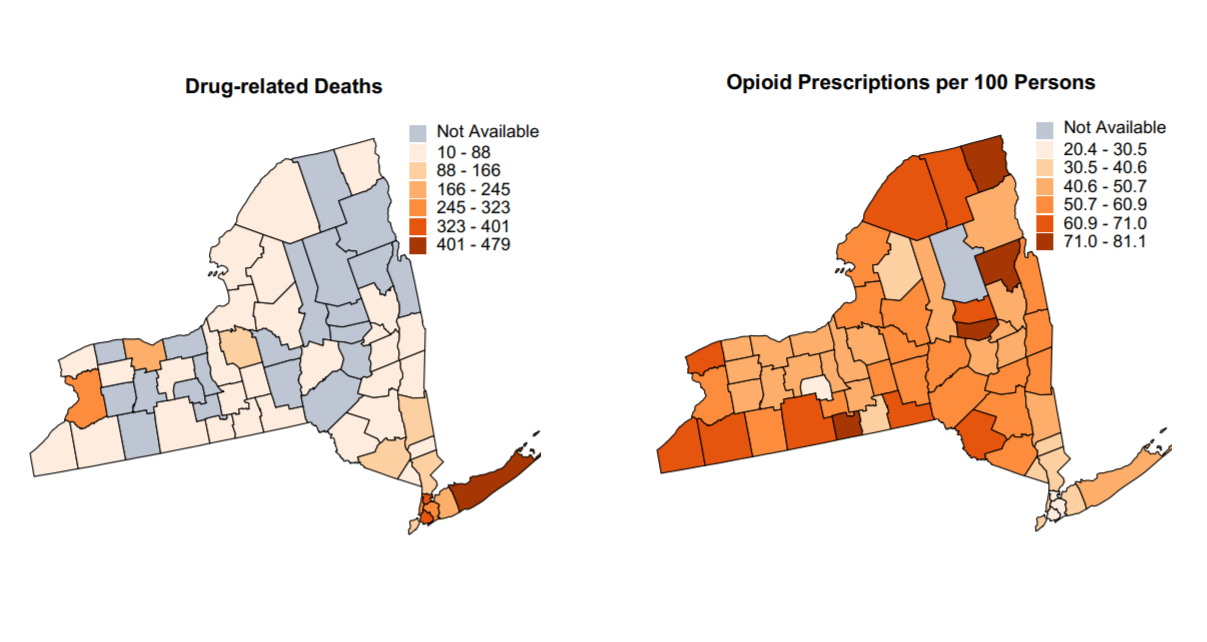
Comparing data from New York, we can see that in 2017, the rate of opioid-involving deaths was 16.1 deaths per 100,000 persons compared to the average national rate of 14.6 deaths per 100,000 persons. In New York, someone dies of a drug overdose every 7 hours, and 82 percent of the 1,374 overdose deaths in 2016 were from an opioid. As an overview, the following maps show the number of drug related deaths, as well as the number of opioid prescriptions in different counties.
The aforementioned figures lead us to focus on the aspects of this crisis in NY counties. Our goal is to find out any meaningful trends in demographics of people who were affected by opioid overdose in New York. For instance, can we see any alerting trends in certain age groups, gender, or racial groups? How do these trends change over the years? Also, historically, we know that drug epidemics have been mostly limited to cities, but it is interesting to know that there have been opioid overdoses spikes taking place in suburban and rural areas, recently. So, we also want to investigate the difference of opioid-related death in urban and rural areas. We also wanted to explore the number of emergency room visits, the number of opioid-related death, and the number of pills prescribed to see if there is any meaningful and significant relationship between the different counties of New York. We hope that through this exploration, we can elucidate the role that public health can play in allaying this deadly, fast-growing epidemic.
Initial Questions
When investigating our datasets described below, we were primarily interested in urban vs rural communities as they related to opioid deaths. We were also interested in the county-level differences within New York, particularly because the state has a wide variety of types of development. Manhattan is very different from somewhere upstate, like Albany. We thought it would be interesting to consider the trends in pill prescription of different counties. Additionally, we wanted to look into opioid-related treatment visits in the counties in New York.
As the project evolved, we became curious about more individual-level data as well as the county level data described above. We thought that investigating demographics could provide insight into the opioid epidemic in New York. This led to questions about whether or not opioid deaths change over time with respect to race, age, or gender. Finally, we wanted to know if the type of insurance a person had related to the number of opioid-related facility visits. For example, were there more visits paid for by Medicare vs Medicaid?
Our final research questions were as follows:
How do opioid deaths change over time in the following categories:
Race
Age
Gender
Rural/Urban
How does the type of insurance a person has relate to the number of opioid-related facility visits?
How do opioid related treatment visits and deaths differ by county?
How do the number of pills prescribed differ by county over time?
Data
amfAR Data: Distance to Treatment Facility amfAR is a non-profit which publishes data related to the HIV epidemic. The data set we utilized contains the average distance from each county to an opioid related treatment facility.
New York State Health Data: Opioid related Treatments and Deaths This data set details opioid related treatments from, including both inpatient and outpatient treatment for opioid diagnoses from 2010 to 2015. The data is then categorized by county, year, whether the county is urban or rural, and the insurance of the patient. An additional data set in the New York health data which included the number of opioid related deaths from 2003 to 2017 was also utilized.
ARCOS Data: Pills Prescribed by County The ARCOS data set is published by the Washington Post as part of a database which tracks opioid prescriptions from manufacturer to patient between 2006 and 2012. We utilized the data related to the number of pills prescribed to patients in each U.S. county, filtering for the counties in New York state.
Government Data: Medication Take-Back Facilities Finally, we used government data which provided the location of medication take-back facilities. This data was limited to counties in New York state, and the distance was mapped against opioid related deaths and treatments. The medication take-back facility data was collected in 2017.
Exploratory Analysis
We loaded and cleaned the data, filtering by relevant years and joining appropriate datasets.
opioid_death_data = janitor::clean_names(read_csv('./data/opioid_related_deaths_2.csv'))

opioid_treatment_distance = janitor::clean_names(read_csv('./data/distance_to_treatment.csv'))

opioid_demographics = janitor::clean_names(read_csv("./data/opioid_demographics.csv"))

opioid_er_data = read_csv('./data/opioid_related_visits.csv') %>%
  janitor::clean_names()

prod_county = arcos::summarized_county_annual(state = "NY", key = "WaPo") %>%
  janitor::clean_names()

county_pop = arcos::county_population(state = "NY", key = "WaPo") %>%
  janitor::clean_names()

# clean opioid death data #

opioid_death_data = opioid_death_data %>%
  filter(year >= 2010) %>%
  mutate(county = recode(county, "Kings (Brooklyn)" = "Kings",
                         "New York (Manhattan)" = "New York",
                         "St Lawrence" = "St. Lawrence"))

# clean opioid er data #

opioid_er_data = opioid_er_data %>%
  select(year, patient_county_name, rural_urban, payer, er_opioid, inpatient_total_opioid, er_inpatient_total_opioid, outpatient_opioid, overall_opioid) %>%
  rename(county = patient_county_name)

# Combine Data Sets #

opioid_total_data = left_join(opioid_er_data, opioid_death_data, by = c('county', 'year')) %>%
  arrange(county, year)
In our analysis, we created a series of graphs and animations which detail how the opioid crisis is affecting New Yorkers in different areas of the state over time. The information below is synthesized from the results of our analysis.
Demographics
Initially, we were interested in how demographics altered opioid addiction over time. We broke down the death count by age, race and gender. The plots, which are included under the demographics tab in analysis, show the following trends related to opioid overdosing.
- There are significantly more men than women who die of opioid related deaths. In recent years that differential has only increased.
opioid_demographics %>%
  filter(region == "NYC") %>%
  group_by(year, sex) %>%
  summarize(
    count = sum(opioid_poisoning_deaths)
  ) %>%
  plot_ly(x = ~year, y = ~count, type = "bar",
color = ~sex, alpha = 0.5)- Non-Hispanic white people are more likely to die of opioid poisoning compared to people of other races/ethnicities, on average. Though there has been an increase in opioid related deaths for all ethnicities, white non-Hispanic people continue to be at higher risk for opioid poisoning.
deaths_age_grp = read_csv("./data/deaths_age_group.csv") %>%
  janitor::clean_names() %>%
  pivot_wider(
    names_from = age_group,
    values_from = opioid_poisoning_deaths
  ) %>%
  janitor::clean_names()


deaths_by_year = deaths_age_grp %>%
  select(year, region, race_or_ethnicity, sex, total) %>%
  group_by(year, race_or_ethnicity) %>%
  summarize(
    count = sum(total)
  ) %>%
  mutate(
    race_or_ethnicity = factor(race_or_ethnicity, levels = c("Not Stated", "Other Non Hispanic", "Black Non Hispanic", "Hispanic", "White Non Hispanic"))
  )

deaths_by_year %>%
  plot_ly(x = ~year, y = ~count, type = "bar",
color = ~race_or_ethnicity, alpha = 0.5)- We see an exponential increase of opioid poisoning deaths between the ages of 20 and 64 from 2004 and 2016. All other ages remained relatively stable at low levels of opioid related deaths between those years.
deaths_by_age = read_csv("./data/deaths_age_group.csv") %>%
  janitor::clean_names() %>%
  select(-region, -race_or_ethnicity, -sex) %>%
  filter(age_group != "Total") %>%
  group_by(year, age_group) %>%
  summarize(
    count = sum(opioid_poisoning_deaths)
  ) %>%
  ungroup()

deaths_by_age %>%
  plot_ly(x = ~year, y = ~count, type = "scatter", mode = "lines+markers",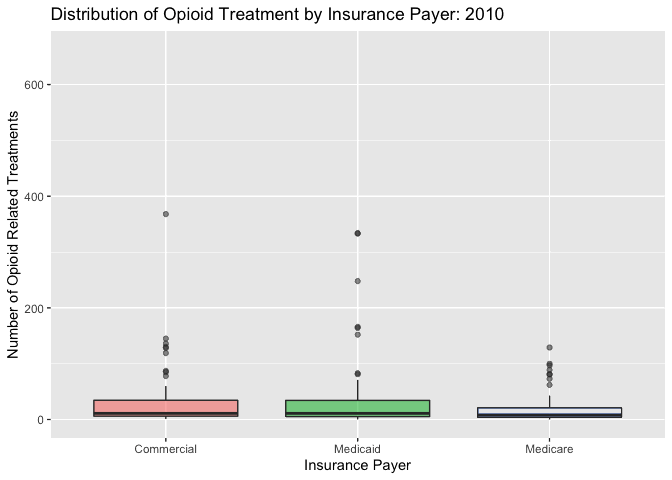
color = ~factor(age_group), alpha = 0.5)- Finally, between the years 2010 and 2015 we notice that the distribution of opioid related treatment is relatively even between commercial insurance and Medicaid with Medicare paying for far fewer cases on average. This seems to change in 2015 when Medicaid outpaces commercial insurance in the distribution of the number of opioid treatments paid for by county.
Trends
Having looked at who the opioid crisis affects in New York state, we were interested in the areas where people were most affected. Therefore, we looked at the death, treatment and perscription trends by county. From our analysis we were able to glean the following information:
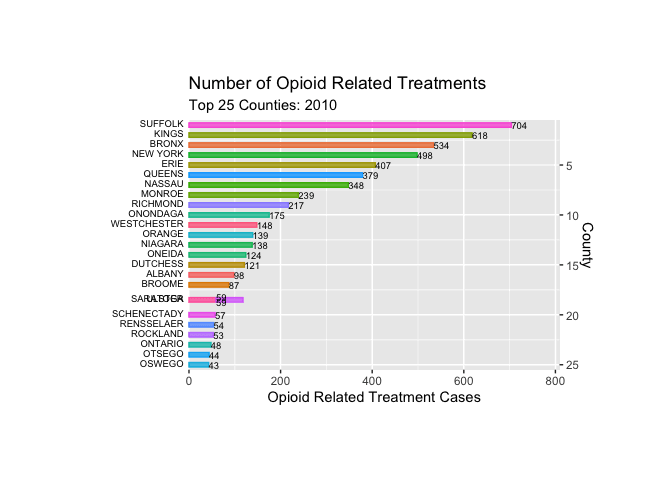
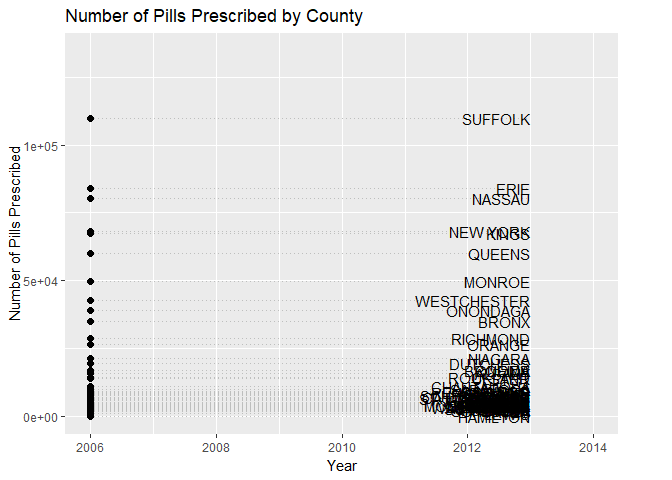
Suffolk county has the third highest death rate related to opioid poisioning and has the highest number of opioid related treatments and number of pills prescribed by doctors.
The counties with the greatest number of opioid related treatments also had a large amount of prescribed opioids, but deaths were not so clearly correlated.
The counties with the highest death rates were also heavily urban counties, with the exception of Sullivan and Green county.
total_death = opioid_death_data %>%
  group_by(county) %>%
  summarize(
    death_sum = sum(opioid_poisoning_deaths)
  ) %>%
  mutate(
    county = toupper(county)
  )

total_pop = county_pop %>%
  select (buyer_county, year, population) %>%
  rename(county = buyer_county) %>%
  group_by(county) %>%
  summarize(

    total_pop = sum(population)
  )

total_death_pop = left_join(total_death, total_pop) %>%
  mutate(
    county = factor(county),
    death_pop = death_sum/total_pop* 1000000,
    county = fct_reorder(county, death_pop)
  )

total_death_pop %>%
  plot_ly(
    x = ~county, y = ~death_pop, split = ~county,
    type = 'bar', alpha = 0.5
  ) %>%
    layout(
    xaxis = list(
      title = "County"),
    yaxis = list(
      title = "Death per 1 Million People"
    )
  )
Discussion
Opioid related injuries included in our data sets were measured by emergency room visits, deaths, and inpatient treatment. Through demographic and trend analysis, we discovered opioid overdose in New York affects white people more than other ethnicities, and men more than women, on average. Opioid overdose also tends to affect young adults (ages 25-34) more than any other age group. Furthermore, we note the number of opioid related incidents in each county is strongly associated with the number of pills prescribed by doctors. This information was, on the whole, expected of our analysis.
One finding that was not expected was that there was no apparent difference between rural and urban areas. This indicates that factors associated with the urban/rural gradient, such as population density, may not have much effect on the prevalence of opioid related injuries. Counties where there were a high number of opioid related treatments did not necessarily have a high number of deaths when adjusting for population size. These counties were further outside of the New York City area, which could be evidence that different interventions may be necessary to prevent opioid related injuries in counties outside the five boroughs. While there is an association between the pills bought per capita and the opioid deaths per 10,000 people, according to our statistical models it may not be safe to assume that reducing opioid prescriptions would decrease opioid injuries.
Note: This was a group project done collaboratively with Olivia Wagner and Julia Thomspson who are also Mailman SPH students.